


SB News - November 2025
New Australian Monthly CPI
Reporting of Australia’s economic statistics finally entered a new era this week with the Australian Bureau of Statistics (ABS) releasing its first complete monthly Consumer Price Index (CPI), bringing the nation into line with all other G20 countries which report CPI each month. However, the inaugural full CPI dataset for October 2025 delivered an immediate shock showing that the fight against inflation is far from over.
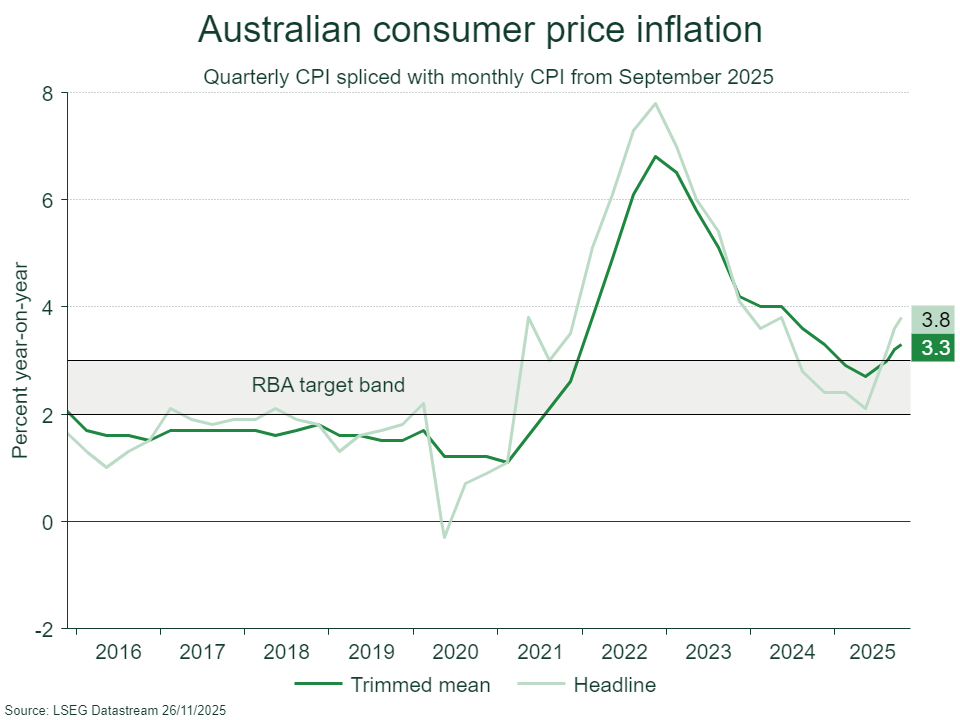
The new CPI report confirmed persistent domestic price pressures, with the annual headline CPI rising from 3.5% to 3.8% in the 12 months to October, exceeding economist forecasts. Crucially, the measure of core inflation preferred by the Reserve Bank of Australia (RBA) – the trimmed mean – also rose from 3.2% to 3.3%, drifting further away from the RBA’s 2% to 3% target band.
The new monthly CPI is a major upgrade by the ABS that supersedes the old quarterly CPI and the partial monthly inflation indicator, which only collected data for about 50% of the CPI basket. The new measure incorporates a full collection of prices for nearly every expenditure component each month, providing policymakers with timely, granular insights into domestic demand and prices, particularly services categories like restaurant meals and hairdressing.
While offering greater timeliness, monthly data is inherently more volatile and likely to be noisy month-to-month. Financial analysts are already favouring 3-month, and 6-month moving averages to filter out temporary price shocks and derive a cleaner signal of the underlying inflation trend. Adding to the complexity, the integrity of the new monthly data is initially weakened by seasonal adjustment issues. The ABS assesses that 25% of the CPI basket lacks the necessary monthly history for standard seasonal adjustment techniques. This means the data is likely to contain residual seasonality and therefore more prone to subsequent revisions until the methodology stabilises after April 2027.
This statistical instability is why the RBA is not planning to immediately adopt the new Monthly Trimmed Mean (MTM) inflation as its core gauge of underlying inflation. Instead, the RBA has committed to an 18-month transition period where it will use the monthly data to inform a “rolling assessment of inflation dynamics,” but anchoring its policy and forecasts to the existing Quarterly Trimmed Mean (QTM), which the ABS will continue to publish during the transition period, so that the RBA can maintain some stability in policy communications.
The RBA’s preferred measure of underlying inflation is still up for grabs, and it is committed to a formal assessment of various underlying measures based on several performance criteria, including predictive utility and bias. Given the RBA’s historical preference for trimmed mean and weighted median measures over other measures, such as inflation excluding food and energy, the MTM remains a candidate, but only if it proves statistically robust over time.
The October release delivered a “pretty ugly” inflation print, according to analysts. The pick-up was broad-based, driven by strong growth in services prices, which accelerated to an annual rate of 3.9%. The largest contributor to inflation overall remains housing, which surged 5.9% year-on-year. This acceleration in demand-driven services prices reinforced the view that monetary policy settings may not be restrictive enough. Following the CPI release, financial markets cut expectations for future rate cuts, with some analysts and market pricing even suggesting a small chance of a rate hike in 2026.
For the next few quarters, analysts must also look past temporary distortions, such as the large, temporary drop in electricity prices due to government rebates in October, which mechanically pushed the monthly headline figure down. The underlying message from the new data seems clear: domestic price momentum appears strong. In our view the RBA is likely to remain on hold for some time as it assesses the incoming data on inflation and labour market tightness.
By Nick Ryder, Chief Investment Officer
Fresh Cracks in U.S. Private Credit Expose Deeper Structural Risk
Recent events in the U.S. private credit market suggest that rising stress is no longer theoretical but increasingly visible across named borrowers, large managers, and fund structures. While overall default rates remain manageable, the nature of the latest incidents points to vulnerabilities that cut across underwriting discipline, collateral verification, and liquidity design.
One of the most serious developments centres on HPS Investment Partners, the large private credit manager now owned by BlackRock. HPS has been drawn into a widening criminal investigation after flagging what it believes to be fraudulent receivables used as loan collateral by telecom companies linked to entrepreneur Bankim Brahmbhatt. Borrowers including Broadband Telecom and Bridgevoice allegedly secured financing using documentation supporting approximately US$400 million of receivables that prosecutors now suspect were fabricated. The case has highlighted a particularly uncomfortable risk for private credit investors: losses stemming not from economic downturns, but from misrepresentation and failures in collateral verification—problems that often surface only after capital is deployed.
At the same time, Blue Owl Capital has faced scrutiny following its decision to abandon a proposed merger between its listed private credit vehicle, Blue Owl Capital Corporation (OBDC), and its non-traded fund, OBDC II. The transaction, cancelled on November 19, would have effectively converted private holdings into publicly traded units at a discount of roughly 20% to stated net asset value, with investors restricted from redeeming until after completion. The backlash forced Blue Owl to retreat, triggering a share price decline and renewing questions around valuation discipline and liquidity mismatches in closed or semi-liquid structures.
These examples are not occurring in isolation. Fitch Ratings recorded six private credit default events in October, involving four unique borrowers, pushing the market’s observed default rate to just above 5% for the month. While this remains below levels seen during severe downturns, it marks a clear upward drift from earlier in the year and reflects pressure within more leveraged and opaque segments of the market.
The backdrop to these developments echoes recent warnings closer to home. APRA has cautioned that risks are building outside the traditional banking perimeter, particularly among non-bank lenders and private market exposures held via superannuation portfolios. While not singling out individual funds, the regulator has emphasised the growing interconnectedness between offshore credit markets and domestic capital flows, raising the prospect that stress in U.S. private credit could transmit through valuation channels or investor sentiment into Australian portfolios.
High-profile investors have also become increasingly vocal. Jeffrey Gundlach recently warned that private credit has become fertile ground for “garbage lending”, pointing to the rapid expansion of the asset class, rising complexity, and deteriorating transparency as ingredients for a broader reckoning.
For investors, the message is evolving rather than alarmist. Private credit still offers necessary diversification and yield, but recent episodes demonstrate that risk is becoming more dispersed and less predictable. As defaults tick higher and scrutiny intensifies, the focus for allocators is shifting decisively from headline yield towards borrower quality, documentation integrity, and the true liquidity profile of the underlying assets.
By Joey Mouracadeh, Senior Investment Director
Is an Oil Supply Glut on the Horizon?
JP Morgan believes global oil markets are in for a rough few years, warning that Brent Crude oil could fall under US$40 a barrel by the end of the 2027 financial year, if producers fail to curb the rapidly expanding supply pipeline. In a recent note to clients, JP Morgan emphasised that the world is heading towards a significant oil supply surplus, driven by accelerating production in non-OPEC+ nations. JP Morgan expects demand growth to remain firm in 2026 and accelerate further in 2027, taking total demand to be more than 105 million barrels per day (bpd). However, even this steady upward trajectory is unlikely to counteract the scale of new supply entering the market. JP Morgan believes that global supply will expand at nearly three times the pace of demand, with roughly half of this new supply being driven by producers outside the OPEC+ alliance. This dynamic is expected to generate large market surpluses (close to 3 million bpd). In the absence of voluntary supply cuts, surpluses of this magnitude could push Brent Crude oil to as low as US$42 per barrel in 2027 and subsequently under US$40 per barrel by year-end.
Nonetheless, the head of JP Morgan’s global commodities strategy is confident that producers will almost certainly respond by cutting output once prices fall to levels that threaten their profitability. Reflecting this, JP Morgan has retained its view that Brent Crude oil will remain somewhat range bound between US$55 and US$60 per barrel in 2026 and 2027, assuming proactive supply management. In the event that prices do decline sharply, the bank anticipates that the lower pricing will spur along stronger demand while simultaneously forcing production closures amongst some high cost, non-OPEC+ producers, both of which would help rebalance the market. Regardless, year-to-date Brent Crude oil has already declined 16% amid rising OPEC+ production in the latter half of the year and as JP Morgan has suggested, if there is not disciplined supply management from both OPEC+ and non-OPEC+ producers, global oil markets may be entering a prolonged period of oversupply and structurally lower prices.
Although many may find it prudent to avoid markets filled with uncertainty, it does provide an interesting investment opportunity for active fund managers, particularly those who have the ability to make high conviction investment decisions within their equity portfolios. In the event of an oil oversupply, where prices drift steadily lower, active managers have the ability to reduce their long exposure to the energy sector, which would face industry headwinds as a result of a structurally weaker oil price. At the same time, if the supply dynamics were to improve as a result of production cuts from OPEC+ nations, active managers would be able to respond by increasing their long exposure to the energy sector. Nonetheless, a disorderly oil market could become a particularly rich source of investment returns for high calibre investment managers, particularly those who are willing and able to make high conviction investment decisions, the likes of which we are currently familiar with.
By Joseph Nakhoul, Investment Research Analyst
AI Showdown: Google v. Nvidia et al
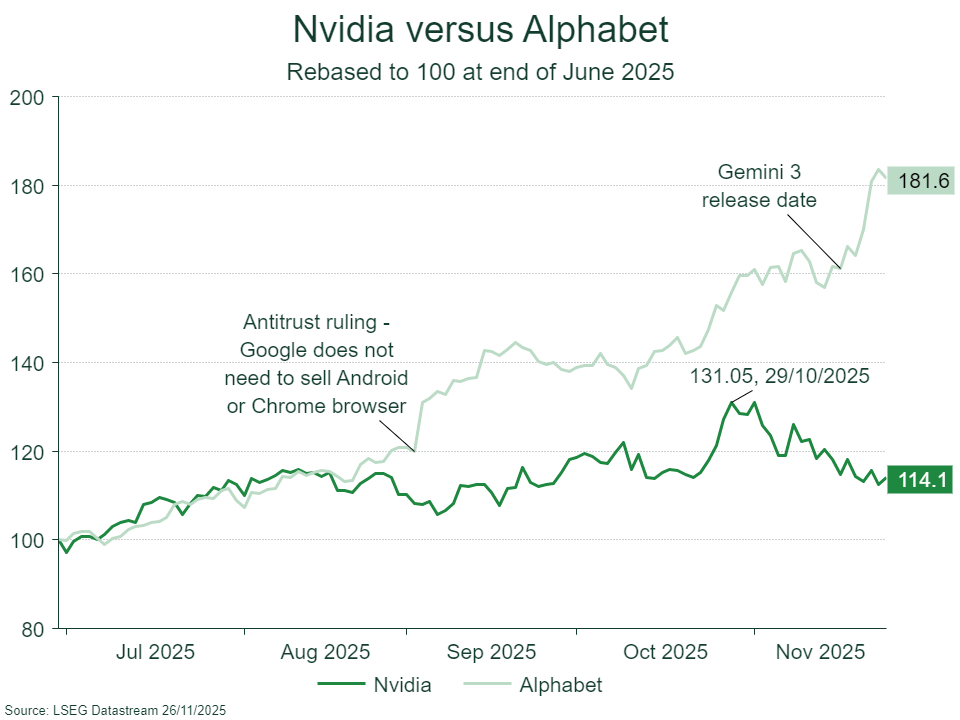
The artificial intelligence trade, long dominated by the performance of semiconductor giant Nvidia, has splintered in late 2025, sending two of the AI sector’s key players in opposite directions. Despite Nvidia reporting very strong third-quarter earnings recently, its stock price has dropped, sliding around 12% this month, while shares of Alphabet (Google’s parent company) have surged, rising 35% since mid-October. This divergence is not due to Nvidia’s financial performance, but market concerns over the competitive threat from Alphabet’s vertically integrated AI ecosystem.
Nvidia’s financial results remain impressive. The company reported record quarterly revenue of US$57.0 billion, up 62% year-over-year. The crucial Data Centre segment, the engine powering the AI boom, delivered a record US$51.2 billion in revenue, up 66% annually. Nvidia’s ability to consistently beat analyst expectations highlights the ferocious demand for AI infrastructure. Furthermore, Nvidia CEO Jensen Huang noted that chip demand continues to accelerate, with sales of its latest Blackwell GPU chip “off the charts” with its cloud GPUs sold out.
However, the market’s focus has shifted from historical performance to whether Nvidia can continue to dominate the AI chip market in the future, a narrative strongly influenced by Alphabet’s recent success. The launch of Google’s Gemini 3 model last week, may have marked a pivotal moment. Their new large language model (LLM) reportedly outperformed OpenAI’s top GPT-5 in model intelligence across most benchmarks, proving that legacy technology giants can compete with newer, more nimble start-ups like OpenAI when developing frontier AI models.
Crucially, the Gemini models were trained entirely on Google’s custom silicon chips called Tensor Processing Units (TPUs), highlighting Alphabet’s strategic pivot toward self-sufficiency and vertical integration. This vertical integration – from its own custom hardware (TPUs) and data centre infrastructure (Google Cloud) to its models (Gemini, Nano Banana), proprietary data for AI training (Google Search, Youtube) and consumer applications (Android, Chrome) positions Google as a potential long-term winner of the AI arms race.
Google began developing its TPUs more than a decade ago, spurred by the recognition that off the shelf general-purpose hardware could not efficiently handle the scaling demands of AI. Google engineers estimated that if users ran a new voice-search feature on their phones or Google Home smart speakers for just a few minutes a day, the company would need to double its data-centre capacity. This prediction drove the development of a more efficient processor tailored to Google’s needs, specifically designed to power AI workloads more cost-effectively than general-purpose GPUs or central processing units (CPUs).
The TPU advantage gained immediate market validation in November 2025 with news that Facebook owner Meta Platforms is in talks to deploy Google’s TPUs in its data centres by 2027, potentially renting the chips next year, which sent Nvidia’s stock tumbling. A deal with Meta, one of the world’s largest spenders on AI infrastructure, would solidify TPUs as a credible alternative to Nvidia’s chips. This followed Anthropic’s landmark commitment to use up to one million Google TPUs in a deal worth tens of billions of dollars, securing compute for its Claude AI models.
The appeal of TPUs, which are application-specific integrated circuits, lies in economics. While Nvidia’s GPUs are powerful and flexible, TPUs, are highly efficient for specific tasks such as AI inference workloads (i.e. serving models to users). Industry analysis suggests that Google may obtain its AI compute at roughly 20% of the cost incurred by those purchasing high-end Nvidia GPUs, implying a 4x–6x cost efficiency advantage per unit of compute. This ability to bypass the substantial “Nvidia tax” enables Google to offer far more cost-effective AI services, a strategic advantage that threatens to erode Nvidia’s long-term pricing power and the financial viability of standalone AI model providers such as OpenAI.
This environment of intensified competition benefits hyperscalers, who are seeking alternatives to curb their reliance on a single vendor. The AI hardware sector is rapidly diversifying, moving toward a future where specialised, in-house customised chip designs, like Google’s newest Ironwood TPU, play an increasingly critical role in defining technological leadership. Investors, including Warren Buffett’s Berkshire Hathaway, have rewarded Alphabet for this vertically integrated strategy, seeing it as a powerful, quiet competitive edge in the race for AI supremacy.
For standalone AI model competitors such as ChatGPT developer OpenAI, the competitive environment is getting harder. According to a leaked internal memo from OpenAI CEO Sam Altman, the success of Google’s rival AI has created some “temporary economic headwinds” for the company, and he acknowledged that the “vibes out there to be rough for a bit”. He also lamented that the competition with vertically integrated firms like Google meant OpenAI had to strive to become the “best research lab, the best AI infrastructure company and the best AI platform product company” which is difficult when competing with highly profitable and deep pocketed rivals such as Alphabet.
By Nick Ryder, Chief Investment Officer
Black Friday in Australia from American curiosity to a central retail event
Black Friday began as a very local American phenomenon. In the 1950s Philadelphia police used the term to describe the traffic gridlock, crowded footpaths and general disorder that followed Thanksgiving. It was not a celebration. It was the day suburban shoppers poured into the city on their day off, filling department stores and overwhelming the transport network. The name stuck for all the wrong reasons.
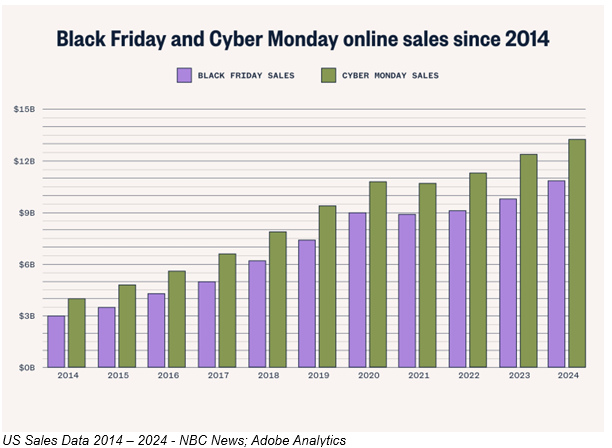
Through the 1960s and 1970s the phrase spread to other parts of the United States. In the 1980s retailers attempted to reframe the term with a more positive spin by promoting the idea that Black Friday was the point in the year when store profits turned from red ink to black ink. This helped shift the public perception from a day of chaos to a day associated with marketing, sales events, and the beginning of the holiday trading period. The real transformation came with the rise of online shopping, which turned what was once an in-store frenzy into a global retail event. By the late 2010s major American retailers had expanded Black Friday promotions across digital channels, and online sales began to rival or exceed the volumes traditionally seen in store. By the early 2020s the sales period had stretched well beyond a single Friday, with retailers launching offers earlier in November and carrying them through to the days after Cyber Monday.
How it took hold in Australia
Australia is an interesting case because we do not celebrate Thanksgiving and Black Friday has no natural cultural anchor here. Its adoption has been almost entirely driven by global retail integration. As large American retailers began promoting online sales into Australia, local consumers quickly became aware of the scale and depth of Black Friday discounts. Australian retailers found themselves compelled to match those offers to remain competitive.
Over roughly the past decade Black Friday has grown from a niche online curiosity into one of the largest shopping periods of the year. The combination of international retailers, global e-commerce platforms and the search for value has created a strong shift in purchasing behaviour. Many Australians now wait for Black Friday to make large household or technology purchases, and in some categories, it has started to rival and exceed Boxing Day in sales intensity.
Another feature of the Australian context is the blend of online and in store behaviour. While Australia has a high rate of online shopping, the Black Friday period still drives significant foot traffic into shopping centres as retailers use it to clear inventory ahead of Christmas. In practice it has become the unofficial start to the Australian festive shopping season.
A shift in seasonal spending patterns
Black Friday has also changed the rhythm of the Australian retail calendar. Ten years ago, most seasonal spending peaked in early to mid-December and again after Christmas. Today many households pull forward a considerable amount of their Christmas shopping into late November to take advantage of the discounts. This has created a more pronounced bulge in November turnover and a flatter profile in December. The annual sales cycle has also stretched. Rather than a single day of intense activity, Black Friday has evolved into a multi week promotional period. Retailers often begin releasing early offers in mid-November and continue discounting through to early December. This softens the extremes of the traditional retail calendar but creates a longer window of competitive discounting.
Why it matters for understanding the Australian economy
While Black Friday is fundamentally a retail event, its rapid growth in Australia offers a useful window into household behaviour. It provides an early read on how consumers are feeling heading into summer, how sensitive they are to discounts and how willing they are to bring spending forward. It also highlights the increasing influence of global retail cycles on local economic activity.
For investors it becomes one of the seasonal markers that helps interpret the tone of consumer spending. Some years the surge in activity reflects confidence and spare capacity in household budgets. Other years it reflects cost conscious behaviour with shoppers hunting value rather than increasing overall spending. What is clear is that Black Friday is no longer just an American tradition observed from afar. It has become a permanent and influential part of the global retail landscape.
By Vincent O’Neill, CEO
Latest Podcast
SB Talks: A Conversation with Former RBA Governor, Ian Macfarlane AC
In this Special Edition of SB Talks, CEO Vincent O’Neill is joined by former RBA Governor and Stanford Brown Investment Committee member Ian Macfarlane for an in-depth discussion on the global economic outlook. Together, they examine the US economy’s performance, the impact of shifting tariff policies on inflation and growth, and the strength of equity markets despite policy headwinds.
Ian also offers his views on the extraordinary surge in AI related investment, the risk of exuberance creeping into financial markets, and why elements of today’s environment echo some of the most significant bubbles in history.
Listen on Apple Podcasts
Watch on Youtube: